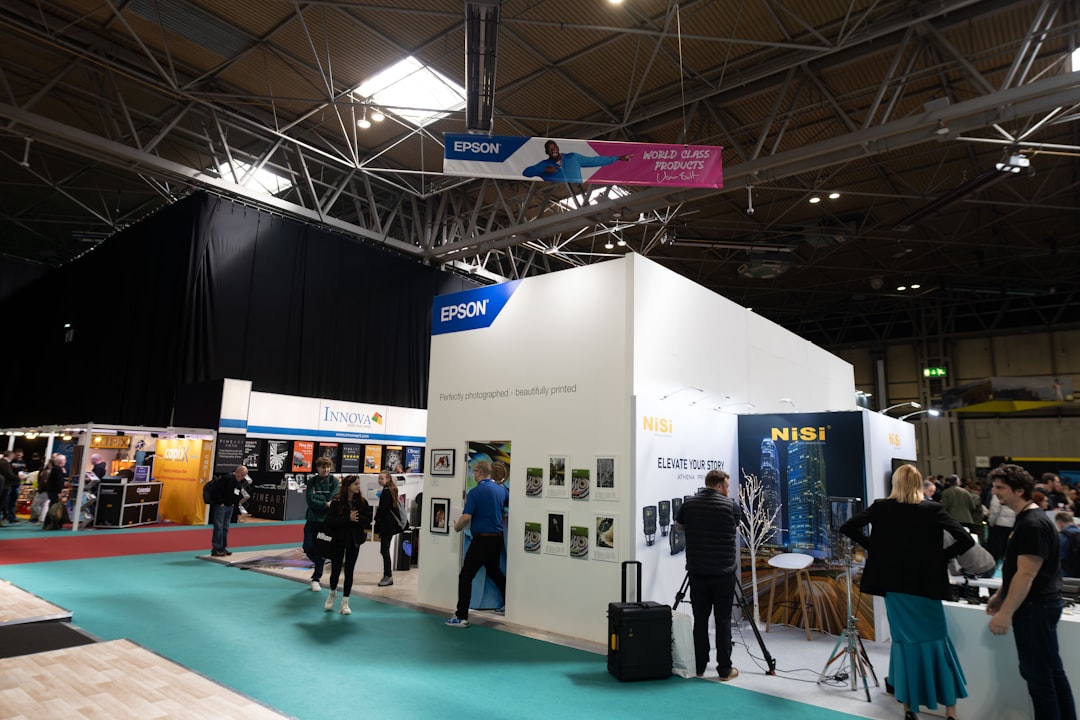
Photo by Jonny Gios on Unsplash
5 Real-Time Metrics Every Exhibition Stand Manager Must Track
The five metrics every exhibition stand manager should track in real time are: visitor footfall, lead capture rate, peak traffic windows, staff engagement ratio, and cost-per-lead. Monitoring these live — not just post-event — lets you make decisions while they still matter, not after the show has packed up.
Key Takeaways
- Footfall tells you how many people walked past or into your stand — the raw input for everything else.
- Lead capture rate shows what percentage of visitors converted into actionable contacts.
- Peak traffic windows help you staff smarter and time your demos and presentations for maximum impact.
- Staff engagement ratio reveals whether your team is actually talking to visitors or standing idle.
- Cost-per-lead anchors every metric to business value and justifies your exhibition budget.
Why does real-time data change everything at a trade show?
Post-event reports are useful. Real-time data is transformative. When you know that footfall dropped 40% after lunch, you can move your most energetic presenter to the floor at 2 PM. When you see lead capture stalling on day two, you can adjust your pitch or swap out a giveaway before the day ends.
Trade shows are compressed, high-cost environments. A three-day event gives you perhaps 18 hours of active floor time. Every decision you defer until the debrief is a decision you made too late.
A post-event report tells you what happened. A real-time dashboard tells you what to do next.
The shift to real-time exhibition analytics is no longer a competitive advantage reserved for large brands with big tech budgets. Platforms like ExpoBridge Pulse make live metrics accessible to any stand manager, regardless of the size of the event or the team.
1. Visitor Footfall — are enough people actually stopping?
Footfall is the number of people who enter or meaningfully engage with your stand space. It is the starting point for every other metric. If footfall is low, no amount of conversion optimization will hit your lead targets.
Track it in real time so you can react fast. If your stand is quiet at 10 AM while the floor is busy, that is a signal problem — your signage, positioning, or draw is not working. You still have time to fix it.
Beyond raw counts, look at dwell time — how long visitors stay. A stand with high footfall and low dwell time suggests people are curious but not engaged. That is valuable intelligence you can act on immediately by repositioning a demo or changing your opening question.
2. Lead Capture Rate — are visitors becoming prospects?
Lead capture rate is the percentage of visitors who give you a scannable badge, fill in a form, or leave contact details. It is your single most important conversion metric at any exhibition.
Real-time visibility here is critical. If 200 people walked in and only 4 have been captured by mid-morning, something is broken — whether that is staff confidence, the offer, or the mechanics of capture itself. You can diagnose and fix this on day one instead of reading about it in a Monday morning report.
A healthy lead capture rate varies by industry and event type, but as a working benchmark, aim for 20–30% of engaged visitors. If your rate is significantly below that, treat it as an alert, not a statistic.
3. Peak Traffic Windows — when is your audience actually there?
Every exhibition floor has rhythm. Traffic surges after keynotes, thins out during lunch, spikes again before closing. If you do not know your peak windows in real time, you are guessing when to run your best demos, when to staff up, and when to give your team a break.
Real-time traffic data lets you build a live schedule instead of a fixed one. Move your product demonstration to align with the next surge. Pull a team member off the floor during the quiet window for a quick debrief. Send your strongest closer to the stand entrance five minutes before the afternoon rush.
Your staffing schedule should respond to the floor, not the other way around.
Over multiple days, peak traffic patterns also help you front-load your highest-value interactions. Day one tends to be the most active at most trade shows. If you know that, you prioritize senior decision-maker conversations before the floor energy drops on day three.
4. Staff Engagement Ratio — is your team doing the work?
This metric measures how much of your team's active floor time is spent in genuine conversation with visitors versus standing idle, checking phones, or talking among themselves. It is uncomfortable to measure, but it is one of the highest-leverage numbers you have.
A stand with five staff members where only two are ever actively engaging visitors is effectively a two-person stand. Real-time visibility into this — even through simple observation logs or interaction-tagging tools — lets you coach, rotate, and redirect before the day ends.
Pairing engagement ratio with footfall and lead capture data gives you a complete picture. High footfall, low engagement, low capture rate: a staffing or training problem. High engagement, low footfall: a visibility or positioning problem. The combination tells the story.
5. Cost-Per-Lead — is this stand worth the investment?
Cost-per-lead (CPL) brings every other metric back to business reality. Divide your total stand cost — space, build, logistics, staff, travel — by the number of qualified leads generated. That number needs to benchmark against your other acquisition channels for the result to mean anything.
You cannot finalize CPL until the event ends, but you can track it directionally in real time. If you have spent £18,000 on a stand and captured 12 leads by end of day one, your current CPL is £1,500. You know what you need the final number to look like. You still have two days to influence it.
Real-time CPL awareness creates urgency and focus. It moves lead generation from a vague goal to a visible target your whole team can work toward.
How do you bring all five metrics together without drowning in data?
The risk with real-time metrics is alert fatigue — too many numbers, not enough signal. The solution is a single dashboard that surfaces the five metrics above in one view, with clear thresholds that flag when something needs attention.
ExpoBridge Pulse is built for exactly this. It gives exhibition stand managers a live command view of their stand's performance without requiring a data analyst in the back room. You see what matters, when it matters, so every decision you make on the floor is backed by evidence.
For a deeper look at how to structure your pre-show planning around these metrics, read our guide on setting measurable goals for your exhibition stand.
See how ExpoBridge Pulse tracks these metrics live — book a demo today
Get StartedFAQ
What is the most important metric to track at an exhibition stand? Lead capture rate is the most directly tied to commercial outcomes, but it only makes sense in context of footfall. Track both together as your primary signal of stand performance.
Can I track these metrics without expensive hardware? Yes. Badge scanners, simple interaction logs, and mobile-based tools can cover most of these metrics at low cost. Dedicated platforms like ExpoBridge Pulse consolidate them into a single real-time view.
How often should I review real-time metrics during a show? Check your dashboard at the start of each day, after the morning rush, after lunch, and before close. Five intentional reviews per day is more valuable than constant checking.
What is a good benchmark for lead capture rate at a trade show? For most B2B exhibitions, capturing contact details from 20–30% of meaningfully engaged visitors is a reasonable starting target. This varies significantly by industry, event size, and stand position.
How do I calculate cost-per-lead for an exhibition stand? Add all stand-related costs (space rental, build, travel, staff time, marketing materials) and divide by the number of qualified leads generated. Compare this against your CPL from digital channels to assess relative value.
Frequently Asked Questions
- What is the most important metric to track at an exhibition stand?
- Lead capture rate is the most directly tied to commercial outcomes, but it only makes sense alongside footfall. Track both together as your primary signal of stand performance.
- Can I track these metrics without expensive hardware?
- Yes. Badge scanners, simple interaction logs, and mobile-based tools can cover most of these metrics at low cost. Dedicated platforms like ExpoBridge Pulse consolidate them into a single real-time view.
- How often should I review real-time metrics during a show?
- Check your dashboard at the start of each day, after the morning rush, after lunch, and before close. Five intentional reviews per day is more valuable than constant passive checking.
- What is a good benchmark for lead capture rate at a trade show?
- For most B2B exhibitions, capturing contact details from 20–30% of meaningfully engaged visitors is a reasonable starting target. This varies by industry, event size, and stand position.
- How do I calculate cost-per-lead for an exhibition stand?
- Add all stand-related costs — space rental, build, travel, staff time, marketing materials — and divide by the number of qualified leads generated. Compare against your CPL from digital channels to assess relative value.