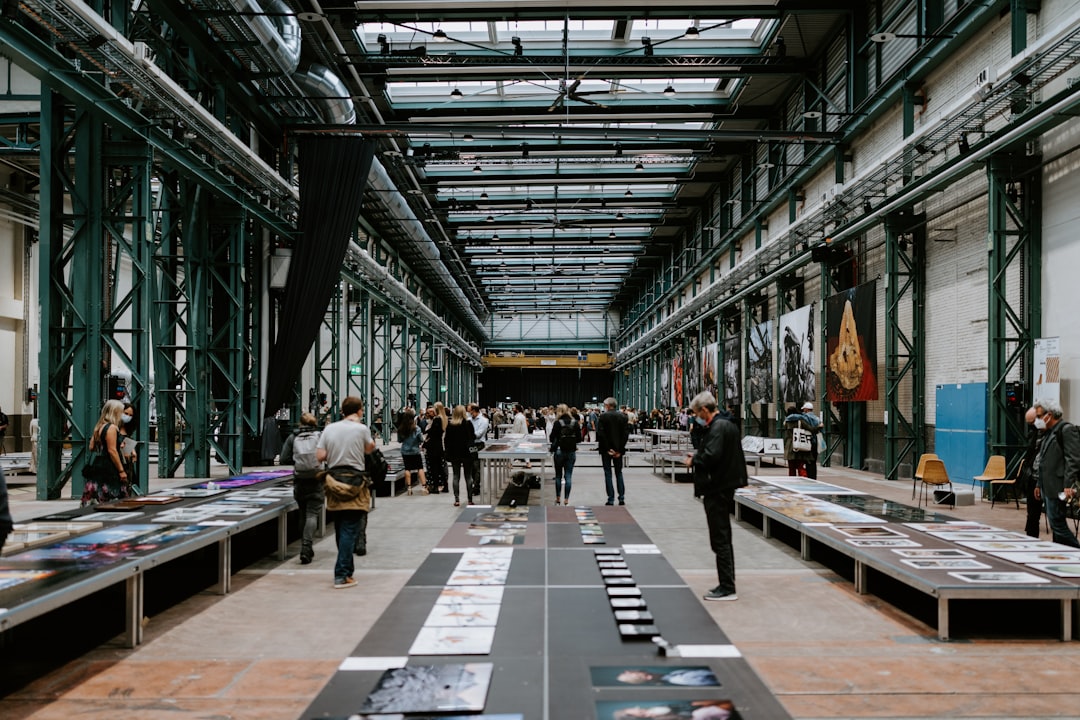
Photo by Claudio Schwarz on Unsplash
Collect Visitor Data at Exhibitions Without Disrupting the Experience
Collecting visitor data at exhibition stands doesn't have to mean clipboard handoffs, badge scanners shoved in someone's face, or awkward form-filling pauses. The most effective approach is passive-first, active-second: let smart technology capture footfall, dwell time, and engagement signals in the background, then use those insights to start better conversations — and only ask visitors for contact details when the moment genuinely calls for it.
Key Takeaways
- Passive data collection (traffic counts, dwell time, heat mapping) happens without interrupting visitors at all
- Real-time dashboards let your team prioritize high-interest visitors before they walk away
- Digital lead capture tools replace clipboards without adding friction to conversations
- Badge scanning alone misses most engagement signals — layer it with behavioral data
- The best data collection feels invisible to the visitor and effortless for your team
Why Traditional Data Collection Breaks the Booth Experience
Ask any seasoned exhibitor what kills momentum at their stand and they'll tell you the same thing: the moment a staff member pivots from a real conversation to "Can I just grab your details?" the energy drops. Visitors go from engaged to guarded in seconds.
Traditional methods — paper sign-up sheets, manual badge scans, business card bowls — create a transactional dynamic that works against you. They also produce incomplete data, since most visitors never make it to that point in the interaction. You end up with a spreadsheet of twenty contacts from a booth that saw two hundred visitors.
The bigger problem is that you're flying blind in real time. You don't know which display attracted the most attention, which staff member converted the most leads, or when your peak footfall actually occurred. Without that behavioral data, every future event is a repeat of the same guesswork.
What Does Passive Data Collection Actually Mean?
Passive data collection means capturing behavioral signals that don't require any action from the visitor. Think of it as observational intelligence: sensors, cameras, and counters that record traffic patterns, dwell time at specific display areas, peak visit windows, and return visitor rates — all without a single human interaction.
At the booth level, this looks like people counters at entry points, anonymous heat mapping that shows which product zones get the most attention, and time-stamped traffic data that tells you exactly when the stand is busiest. None of this requires a visitor to pause, scan anything, or hand over personal information.
The value isn't just retrospective. When you have a live dashboard showing that a specific product display has held visitors for an average of four minutes today, your team knows to anchor conversations there. Passive data becomes active strategy in real time.
The best data your booth collects should be invisible to the visitor and indispensable to your team.
How Do You Layer Active Lead Capture on Top Without Adding Friction?
Once passive data is doing its job, active lead capture becomes much easier — because it's selective and well-timed rather than desperate and indiscriminate.
Digital lead capture tools — tablet-based forms, QR codes linked to a landing page, NFC-enabled business card exchanges — replace the clipboard without adding formality to the conversation. A well-designed QR code on a product display lets an interested visitor pull up a spec sheet, a demo request form, or an instant brochure download without your staff member having to break stride at all.
Badge scanning has its place, but treat it as a baseline rather than a strategy. Scanning someone's badge tells you they were present. Combining that scan with behavioral data — how long they spent at your stand, which zones they visited, how many times they passed by — tells you whether they're worth a follow-up call or a nurture email.
How Should Your Team Use Real-Time Data During the Show?
Real-time dashboards change the game for your booth staff. Instead of treating every visitor the same, your team can see which individuals or groups have spent the most time at specific displays and prioritize those conversations accordingly.
If your dashboard shows a spike in traffic every day between 11am and 1pm, you know to have your strongest product specialists on the floor during those hours rather than on break. If a particular zone is consistently underperforming on dwell time, your team can proactively adjust — reposition the display, change the demo, or redirect foot traffic with a different opener.
This kind of agile decision-making is what separates high-performing exhibition teams from those who wait until the post-show debrief to figure out what went wrong. By that point, the leads have gone cold and the show is over.
For a deeper look at how real-time analytics translate into booth performance metrics, explore how ExpoBridge Pulse structures its live exhibition reporting dashboard.
What Are the Privacy and Consent Considerations?
Passive behavioral data — anonymous footfall counts, aggregate heat maps, dwell time averages — generally does not capture personally identifiable information, which keeps it outside the scope of GDPR and similar regulations in most implementations. You're measuring crowd behavior, not tracking individuals.
When you move to active lead capture — names, emails, phone numbers — consent becomes mandatory. Digital forms should include a clear opt-in checkbox with a one-line summary of how the data will be used. Make it frictionless but make it explicit.
Badge scanning under a show organizer's platform typically operates under consent collected during attendee registration. Still, it's good practice to verbally confirm with visitors that you're capturing their details before you scan. It takes two seconds and builds trust rather than eroding it.
The Stack: What Tools Work Together?
A practical exhibition data collection stack doesn't need to be complex. At minimum you want three layers working together:
Traffic intelligence — people counters or sensor-based footfall tracking that gives you real-time and cumulative visitor counts, segmented by time of day and stand zone. This is your foundation.
Engagement analytics — dwell time tracking by zone, heat mapping if your stand layout allows it, and optionally, display interaction data if you're running digital screens or interactive demos. This tells you what's working.
Lead capture — digital forms, QR codes, badge scanning, or NFC tools that convert engagement into contact records. This is what your CRM actually needs.
When these three layers feed into a single dashboard, you stop managing data collection as a chore and start using it as a competitive advantage.
FAQ
See how ExpoBridge Pulse captures exhibition data in real time — book a demo
Get StartedFrequently Asked Questions
- Does passive data collection at exhibitions require visitor consent?
- Anonymous aggregate data — footfall counts, dwell time, heat mapping — typically does not capture personally identifiable information and generally falls outside GDPR consent requirements. However, you should always verify compliance with local regulations and your event's specific terms.
- What is the difference between badge scanning and behavioral data?
- Badge scanning records that a visitor was present at your stand. Behavioral data — dwell time, zone engagement, return visits — tells you how interested they were. Combining both gives you a far more accurate picture of lead quality than either does alone.
- How do QR codes improve lead capture without disrupting conversations?
- QR codes placed at natural pause points — product displays, demo screens, spec sheets — let visitors self-initiate data exchange when their curiosity is highest. This removes the awkward staff pivot to 'Can I take your details?' and keeps the conversation natural.
- When during a show should we review our visitor data?
- Ideally, you review a real-time dashboard continuously throughout each show day. End-of-day reviews let you adjust strategy overnight. Waiting until the post-show debrief means acting on cold data when all your opportunities have already walked out the door.
- Can small exhibition teams benefit from real-time visitor analytics?
- Yes — arguably more so than large teams. With fewer staff on the floor, knowing exactly when footfall peaks and which zones attract the most attention lets a small team concentrate effort where it matters most, rather than spreading thin across the entire stand.