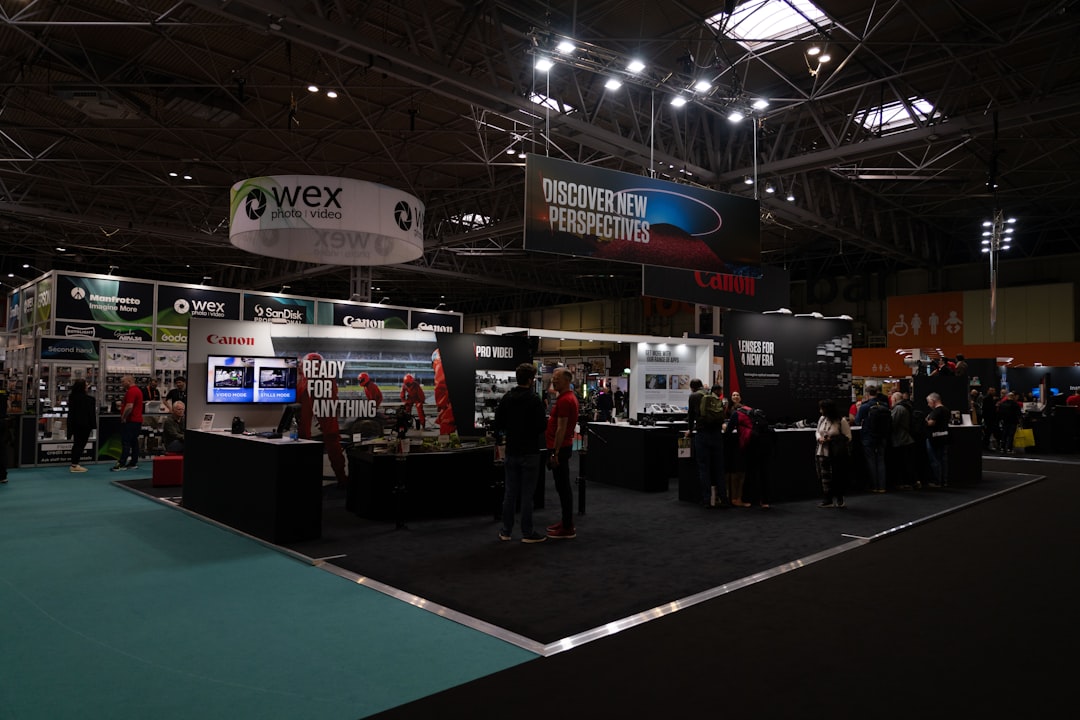
Photo by Jonny Gios on Unsplash
Replace Gut Feeling With Real-Time Exhibition Data
You've spent months planning your stand, invested serious budget, and now visitors are walking past. But you're still making decisions based on gut feeling instead of what your visitors actually think. Real-time data collection changes that. ExpoBridge Pulse turns every booth conversation into actionable insight—with a live analytics dashboard so you can see patterns forming while the event is running and adjust your approach before it ends.
Key Takeaways
- See visitor feedback in real time, not weeks after the event ends
- Collect 94% completion rates with a branded touchscreen experience visitors actually enjoy
- Adjust messaging and booth strategy mid-event based on live data
- Deploy a fully custom survey in days, not weeks of IT back-and-forth
- Replace paper forms and generic tools with a branded data collection system that reflects your investment
Why paper forms and generic tools cost you insight
Paper surveys disappear. Half the sheets are illegible. Data entry after the event takes weeks—if you get to it at all. By then, the event is over, the momentum is gone, and you're analyzing feedback that no longer informs your next move.
Generic tools like Google Forms undermine your brand too. You invested in a premium stand. A basic form next to it signals that you cut corners on visitor engagement. Your competitors notice. Your visitors notice. Your data suffers because people don't engage seriously with throwaway tools.
What you need isn't another survey platform. You need a custom experience that matches your brand, optimized for touch, deployed fast enough to actually be ready for your event.
How real-time dashboards change your decision-making
ExpoBridge Pulse shows you what visitors think while you're still in the booth. You see patterns forming in real time—which messaging resonates, which product features matter most, what objections keep coming up. Then you adjust. You shift your talking points. You refocus the conversation. You don't wait for a post-event report.
One event manager adjusted their messaging mid-fairbased on what the live dashboard revealed. That had never been possible before. A pharmaceutical company collected more usable data in two days than in three years of paper forms. A SaaS company ran three events in two months, with turnaround under a week each time. That's the difference between reacting and acting.
Build once, deploy instantly, focus on your event
You don't need an IT project. You need a survey on Tuesday. ExpoBridge handles the heavy lifting: interface design, touchscreen optimization, device testing, deployment. You send a brief with your brand guidelines and questions. We build it. You get back to running your booth.
Most projects ship within days. No approval chains. No scope creep. No waiting for someone's backlog to clear. Your survey is custom-built from zero—not a template with a logo slapped on. Your colors, your typography, your animation style. Visitors won't know we built it. They'll think you did. That consistency builds trust, and trust gets you better data.
Why completion rates matter more than you think
ExpoBridge surveys achieve a 94% completion rate. People actually enjoy filling them out. They're built for fingers, not cursors—no tiny checkboxes that frustrate touch users. Every element is sized for confident tapping. On a kiosk, that means fewer drop-offs, better data, and visitors who leave your booth impressed rather than frustrated.
That visitor experience reinforces your brand. It shows you care about how people interact with you—down to the button size. Small details like that compound into data quality and brand perception.
Real numbers from real events
A stand manager at an industrial equipment manufacturer said visitors actually enjoyed filling out the survey—something that never happened with paper. A marketing director at a pharmaceutical company deployed their survey the day before the fair and collected more usable data in two days than in three years of previous efforts. An event manager at a marketing agency adjusted their client's messaging mid-event based on live data. These aren't edge cases. This is what happens when you replace guesswork with real-time insight.
Your next event is too important to leave to instinct. You've already invested in the stand. Invest two days in a data collection system that actually works.
Tell us about your event. We'll build your survey in days.
Get StartedFrequently Asked Questions
- How long does it take to deploy an ExpoBridge survey?
- Most projects ship within 3–5 days from brief to live. You send your questions and brand guidelines. We handle design, build, testing, and deployment. No IT involvement needed.
- Can I see the live dashboard during the event if I'm not at the booth?
- Yes. The live analytics dashboard is accessible from any device, so you can monitor responses in real time whether you're on the stand or managing the event remotely.
- Is visitor data secure and GDPR-compliant?
- All responses are encrypted and stored on EU-based servers in full compliance with GDPR. No personal data is collected or stored without explicit consent.
- What if I need to change questions after the survey goes live?
- You can adjust questions, branding, and logic in real time. No need to redeploy or restart—changes take effect immediately.
- Do I need special hardware to run ExpoBridge surveys at my booth?
- No. The system works on any touchscreen tablet or kiosk-mode display. We handle device testing and optimization so deployment is seamless.